Remote Sensing
It has long been understood that light hydrocarbons very slowly seep from oil and gas deposits and migrate to the surface. Once at the surface, their presence affects the local organic material, which in turn make small changes to surface conditions.
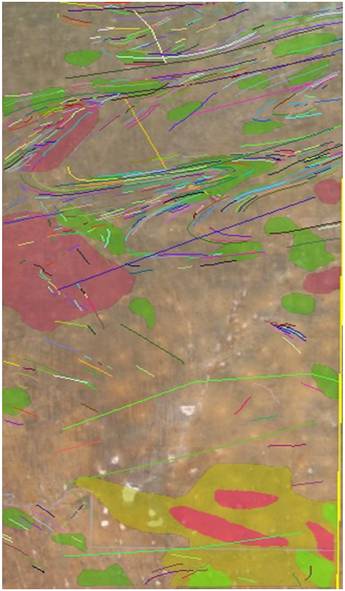
Remote sensing analysis showing surface anomalies found on the Namibian concession.
For example, certain types of bacteria thrive by feeding on hydrocarbons. Although these effects are not noticeable in the visual light range, they can be picked up when analysed through certain electromagnetic radiation frequency filters. Searching for these electromagnetic radiation anomalies is performed using finely tuned satellite imaging cameras.
Electromagnetic radiation anomalies provide an indication of the long-term seepage of hydrocarbons from underground deposits. Such anomalies only show the end point of a seepage route, which can be directly above hydrocarbon deposits in areas with simple geological features, or in more complex geologies, up to 100 km away from the deposit where transverse seepage has occurred.
Remote sensing provides a good indication of the existence of hydrocarbon deposits. To gain an understanding of the source of the hydrocarbon deposits, geochemical samples of the soil need to be analysed. To gain a better understanding of the location of hydrocarbon deposits, one needs to understand the geological composition of the area of study.
In 2013 Africa New Energies partnered with Scotforth Ltd to carry out satellite surveys of our Namibian concessions. This allowed us to gain relatively coarse grain data about this vast and hard to reach region. They used Remote Sensing Direct Detection of Hydrocarbon (RSDD-H) techniques to analyse the images collected and identify anomalies in ground level electromagnetic radiation.
Using this method, 10,000km², 44% of the concession area, was surveyed in detail and 7 High Quality Anomalies were identified. Figure 2 alongside, shows the satellite anomalies found on the Namibian concession. The pink anomalies represent distinct high quality anomalies, the green anomalies represent mid quality anomalies, and the yellow anomalies represent lower quality anomalies.