Pre-feasibility study into solar energy rollout in Namibia
13. Replicating the ANE development strategy into other African countries
This project depends entirely on the accessibility of “stranded natural gas” or some other thermal input, which has a lower price than if it could access the markets. So finding the natural gas or another thermal input is seminal to the successful roll-out of this project.
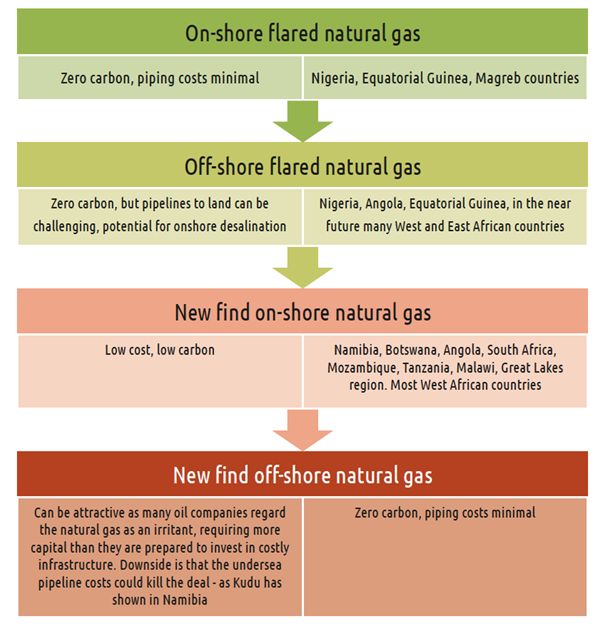
Thermal inputs decision tree
Flared natural gas
The opportunity lies in turning natural gas into market-ready gas-to-liquid (GTL) products, which requires a vast investment as well as substantial access to natural gas. Generally GTL plants cost about $2.5 billion dollars and require a minimum of 1 trillion standard cubic feet, while pipelines cost from $1-$2 million per kilometre on shore, and many times that offshore, so the investment required for the sale of natural gas is many times greater than that of oil. As a result, the vast majority of natural gas produced with oil is either flared or pumped back into the reserve to increase oil extraction rates. The World Bank estimated that over 7 trillion cubic feet of natural gas are flared each year. See below.[1]
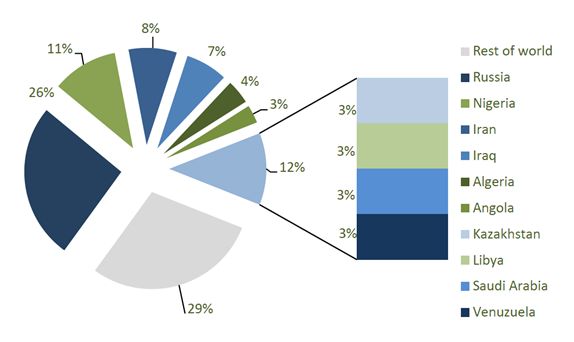
Top 10 countries where natural gas flaring is most prevalent. Africa is responsible for flaring 25% of the world’s flared natural gas
Total flaring in Africa is over 7 trillion cubic feet per year. Nigeria flares about 800 billion cubic feet, while Angola flares over 200 million – about 70% of all natural gas extracted in the case of Angola. If these countries used 50% of the flared gas to generate electricity, they could dramatically increase their electricity production to both economies whose economies are severely hampered by their lack of infrastructure:
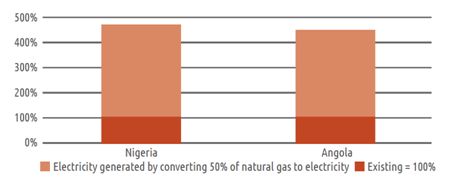
Effect on electricity production if 50% of flared natural gas is converted – Nigeria and Angola
| Model input | Nigeria | Angola |
|---|---|---|
| Natural gas volume currently being flared in billions of standard cubic feet (bscf) | Greater than 800 bscf | Greater than 200 bscf |
| 50% of volume being flared – bscf | 400 bscf | 100 bscf |
| Potential electricity output – based on 60% thermal efficiency | 52 TWh | 14 TWh |
| Existing electricity generation | 15 TWh | 4 TWh |
| Percentage of existing generation the 50% of flared natural gas will add |
The capital cost of converting this natural gas into electricity is about $15 billion in Nigeria (assuming $2.00 per watt capital cost, which is three times the cost of Europe). This is less than ninety days of government oil revenues. Assuming each KWh of electricity increases $1 of GDP, this will grow Nigeria’s economy by over $50 billion, from its $405 billion in 2016, increasing the size of the economy by 30%. This means that the payback in economic growth is less than 60 days, showing how starved the Nigerian economy is for electricity. Economic paybacks of electricity plants are usually counted in years, not days.
The potential to find smaller natural gas deposits in other African countries
The graph below shows where the world’s known giant oil and natural gas fields are:
![Oil endowment (cumulative production plus remaining reserves and undiscovered resources) for provinces assessed. Darker green indicates more resources.[2] United States areas are not included.](https://www.ane.na/wp-content/uploads/2018/08/Clipboard25.jpg)
Oil endowment (cumulative production plus remaining reserves and undiscovered resources) for provinces assessed. Darker green indicates more resources.[2] United States areas are not included.
The Gondwanaland split – 200 million years ago
Most exploration and production interest lies offshore. However, there is every reason to believe that the tectonic plate movements within the African continent create the right conditions for the formation of large oil reserves.
The following paper was produced by Dr Colin Reeves, a pioneering geophysicist, who was instrumental in collecting the first aeromagnetic survey of Botswana in 1974, and has worked on developing access to geological data in Africa for over four decades. His research leads him to believe that the movement between cratons – across Southern African, have significant potential for hydrocarbons, in the same way that reserves have been proved in Sudan and Chad.[3]
Hidden resources in Angola – by Dr Colin Reeve:
“Almost all of Africa is underlain at depth by the Precambrian rocks that made up the supercontinent of Gondwana (Africa, South America, India, Australia and Antarctica) for about 350 million years from its formation at the end of the Precambrian to its eventual fragmentation about 180 million years ago (180 Ma). At times, several episodes of rifting – akin to what is currently happening in East Africa – spread through Gondwana. The Karoo rifting episode (300 to 200 Ma) was evident in southern Africa in many different ways.”
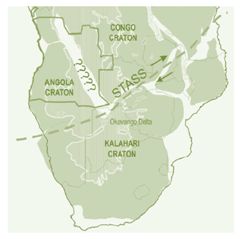
Tectonic fault lines in Southern Africa – STASS stands for Southern Trans‑Africa Shear System
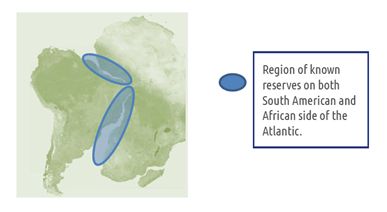
“A major trans-Gondwana rift (STASS) stretched all the way from Namibia through Botswana, Zambia, Tanzania and into Somalia and was active in this period. Then, from about 180 Ma, the older parts of Gondwanaland began ‘unwrapping’ themselves clockwise from around what was to become Africa, starting in East Africa with Madagascar leaving Somalia in the Jurassic and ending with the opening of the South Atlantic Ocean in the Early Cretaceous. The development of the offshore petroleum resources that are now well-known on the South Atlantic margins was a consequence of this process.”
“There are good reasons to suppose that products of both the Karoo and the Cretaceous rifting episodes lie hidden below the Kalahari sand cover of eastern Angola. Clearly these rifts did not develop into oceans like the South Atlantic but they could still host resources in the way the currently active rift does in Uganda, for example.”
“A simple tectonic model divides the continental crust of Africa into strong ‘cratons’ that have defied fracturing and deformation and weaker zones between them where rifting has always tended to concentrate. The exposed Precambrian geology of west and central Angola forms one such craton and the possibility exists that a weak zone of rifting exists east of it, striking NNW from approximately the present-day Okavango delta to east of Luanda in Angola.”
Tectonic activity on this feature could have occurred during the Karoo movements of the STASS, making the supposed eastern Angola rift an analogue of the Muglad rift in southern Sudan. Its orientation is also perfectly suited to reactivation during the earliest phases of rifting along the line of the South Atlantic Ocean itself. Both events hold potential for development of rift basins that could host hydrocarbon accumulations in eastern Angola. Any such rifts would now be hidden below the sand cover. In this way the structure would also be analogous to the oil-prone rift system that extends from Chad through CAR into Sudan and Kenya.”
This is one of many potential lines of investigation that suggest that these fault lines across Africa will yield pockets of stranded natural gas in the same way that this investigation has shown in Namibia. The map below, also created by Dr Reeves shows the major cratons that form Africa, along which most have potential for natural gas.

Tectonic fault lines in Africa
In conclusion, most countries in Africa have the potential to follow ANE’s development strategy and where there is no gas to be found, the Southern African, East African, West African and Central African power pools and emerging gas pipelines – such as the West Africa Gas Pipeline – are making it possible for gas-less countries to benefit from that of their neighbours, fostering a climate of pan-continental economic co-operation.
[1] The Global Gas Flaring Reduction Public Private Partnership – Estimated Flared Volumes from Satellite Data, 2006-2010 http://web.worldbank.org/WBSITE/EXTERNAL/TOPICS/EXTOGMC/EXTGGFR/0,,contentMDK:22137498~pagePK:64168445~piPK:64168309~theSitePK:578069,00.html
[2] Source US Geological Survey – Department of Interior published by Wikipedia
http://en.wikipedia.org/wiki/File:USGS_world_oil_endowment.png
[3] Hidden Resources of Eastern Angola – Dr Colin Reeves – November 2011

0 Comments