Pre-feasibility study into solar energy rollout in Namibia
1. Overview of the Namibian electricity market
Demand and supply for electricity in Namibia
Background
Namibia has a population of 2.5 million people, and a stable multi-party parliamentary democracy. Agriculture, herding, tourism and the mining industry – including mining for gem diamonds, uranium, gold, silver, and base metals form the backbone of Namibia’s economy. After Mongolia it is the second least densely populated country in the world, which along with hosting the world’s highest irradiation levels, makes it an ideal candidate to use off-grid solar to give the poor electricity for the first time.[1] A GDP of $14.6 billion (ppp) shows a GDP per capita of $7,000, the third highest in sub-Saharan Africa, masking one of the world’s most unequal income distributions with a gini-co-efficient of 0.7 – approximately half the population live below the international poverty line[2] – and the nation has suffered heavily from the effects of HIV/AIDS, with 15% of the adult population infected with HIV in 2007.
Despite these challenges, Namibia is regarded as a well-run economy and as one of the most investor friendly in Africa – albeit one with high taxes. The prospect of hydrocarbon riches and a hydrocarbon fiscal regime that will generate handsome government revenues could transform the lives of the country’s poor. They need help – half of the population subsists in rural areas where less than 1% of the country is arable.
The importance of electricity provision within the broader economy – Namibia from a global perspective
While most Namibians the author spoke to do not share these sentiments, Namibia has one of the best electricity infrastructures in Africa, where energy provision was 1,800 KWh per capita.[3] Africa’s average is 555 KWh per year, while India’s is 444 KWh per year. [4] There is a strong correlation between GDP and electricity provision, where a Ugandan study suggested $1 of economic growth was generated by every extra KWh of electricity generated.[5] A separate study suggested that the economic impact of providing one KWh of electricity in Kenya contributed US$0.83 to the economy.[6] This suggests that even investing in the most expensive alternative – utility-scale photovoltaic with battery storage at a levelised electricity cost of 33 US cents per KWh would bring with it economic growth, if the decision were to be made on purely economic grounds and the electricity could be dispatched to those who do not have it.
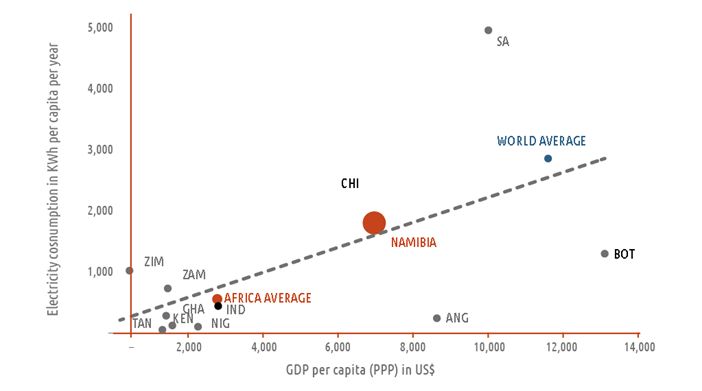
Figure 1. KWh – electricity consumption vs. GDP per capita
Figure 1 shows the relationship between GDP and electricity consumption per capita for selected developing economies – including her neighbours. Namibia receives more electricity than Botswana, which has a GDP per capita of almost twice that of Namibia, but is in a much better position than other neighbours such as Zambia, Zimbabwe (more analysis on in later sections) and Angola. South Africa is particularly well endowed with electricity, because of the demand of its mining and beneficiation which consumes 52% of its electricity.
The demographics of electricity access
Figure 1 KWh electricity consumption vs.GDP per capita – Namibia vs. her regional peers – seems to indicate that Namibia is in a better position than all of her SADC peers bar South Africa when it comes to electricity provision – and is more than triple the African average of 555 KWh per capita. Just as the GDP per capita numbers mask the highest level of income inequality, this seemingly rosy picture masks the inequality of electricity access – just 80,000 of the Namibia’s estimated 350,000 households have access to both electricity and running water with a further 40,000 having access to electricity without running water.[7]
This has and will continue to be a vexing problem – providing electricity to the poor is currently financially unaffordable for the government due to the remoteness and the thin population density of rural communities, and the impermanence of peri-urban informal settlement dwellings.
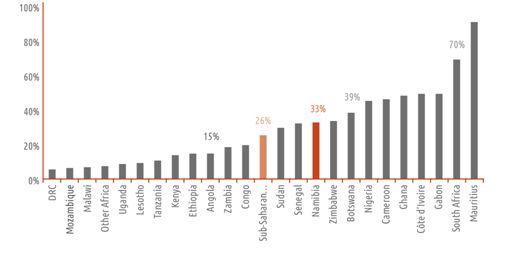
Figure 2. Percentage of population with access to electricity
Sub-Saharan Africa
The graph above benchmarks Namibia’s electricity access to that of its sub-Saharan peers. Some 33% of the Namibia population have access to electricity in their homes in 2005, against the sub-Saharan average of 26%, while Botswana, which has a similar economy and less electricity consumption – does mildly better with 39% access. One of South Africa’s less trumpeted successes is its aggressive electrification programme. In 1994, the year of the country’s first democratic elections, less than 35% of the population had access to electricity in their own homes. By 2005, it had doubled to 70%, and by 2010 had increased to almost 80%. The rise of pre-paid mobile payment services have played an important role in this success, and offers important insights to Namibia, which has the same level of electricity access as South Africa had in 1994.
This graph is also important in the way that it shows how few sub-Saharan Africans are connected to the grids. According to the International Energy Agency (IEA), some 625m people in sub-Saharan Africa were without access to electricity in 2014. The problem is usually threefold – a lack of generation generally, and where there is generation infrastructure, it tends to be old and overly dependent on hydroelectric power – which is susceptible to erratic rainfall. Furthermore, there is a lack of transmission lines and distribution infrastructure – where it exists it is crumbling. For example, one interviewee indicated that in Brazzaville, in the Democratic Republic of Congo, the distribution infrastructure was in such a poor state, that 50% of generated electricity was lost.[8]
| Growth between 2000 and 2010 | Compound average growth rate (CAGR) | |
|---|---|---|
| Electricity demand growth | 72% | 5.6% |
| GDP growth | 55% | 4.5% |
| Energy intensity of GDP growth 2000 – 2010 | 130% | |
| Correlation co-efficient | 98% |
The electricity density is more than double that of South Africa, which is where each 1% of GDP growth results in 0.6% increase in electricity consumption.
The impact of mining and hydrocarbon sector expansion on electricity demand
The mining sector contributes 10% to GDP, 50% of foreign exchange earnings and consumes a large minority of Namibia’s electricity. Scorpion, the world’s 8th largest Zinc mine, increased electricity demand by as much as 15% when it started production in 2004. It is estimated that the mines use over 1,500 GWh of the 3,767 GWh supplied by NamPower in 2010.[9]
Moving energy consumption from diesel to electricity – Namibian mines are following the South African mining trend of using electricity to transport ores wherever possible, as the price of electricity to large mining customers in Namibia has increased by just 300% in the last twelve years against an increase in US$ of 10 fold in the diesel price.
Water shortages – Water is in extremely short supply for Namibia and to cater for the mines in the Walvis Bay area, a reverse osmosis desalination plant was built. This plant processes 20 million cubic meters per year and uses an estimated 4KWh per cubic meter of desalinated water. New mines will require desalination and ground water which will increase electricity demand.
Future trends – Namibia has an investor friendly environment and a plethora of mineral resources– key prospects lie with uranium, rare earths and copper:
- Uranium – Namibia already produces 7% of the world’s uranium and has four new mines in various stages of development. Swakob Uranium, owned by Areva, will increase demand by 60MVA or between 300GWh and 6% of 2010 demand.
- Copper – Tsumeb Mine produced over 1.5 million tonnes at world-leading grades over its 100 year life. There has been a dramatic increase in prospecting in the North that is largely unexplored – Northern Namibia has the potential to become the second to Zambia in African copper production – along with precious metals as bi-products.
- Rare earths – Much to the West’s dismay, rare earths, which are vital to the renewable energy industry, as well as many high tech electronics industries are dominated by China, which started a far-sighted production policy in the 1960’s. China currently produces 95% of the world’s rare earths and the West is falling over itself to find alternative sources. Namibia has a world-class resource.
Hydrocarbons in the medium-term
The Kudu off-shore gas field finally looks like it will be developed, four decades after it was discovered, and with it comes the prospect of an off-shore hydrocarbon boom. Eco Oil and Gas has raised $300 million for Namibian exploration – their reserve off-shore from Kunene is estimated to have 1 billion barrels of extractable oil. HRT – part owned by Petrobas of Brazil – which has successfully exploited similar offshore lithology off the Brazilian Coast. The Energy Minister estimated that Namibia could have as much as 11 billion barrels.[10] 1 billion barrels output is worth 8 years of current GDP, of which half will go to the government, which has a historic opportunity to use old revenues to provide social services to all. This alone will triple residential demand. If half of the 11 billion barrels are recovered over a 40 year period, an average of 500 thousand barrels per day will result in an increase of Namibia’s GDP by $11 billion at current oil prices, causing a sustained, one-off increase in the size of the economy by almost 100% On-shore natural gas and oil prospects are also very promising, which will increase the demand for support services and boost the services sector. The use of on-shore natural gas is the key focus of this proposal.
An interesting point to notice is that Namibia will avoid the economic curse of Dutch Disease where hydrocarbon discoveries fundamentally change the country’s balance of payments – causing the country’s exchange rate to increase. As the Namibian Dollar is linked on a 1:1 relationship with the much larger South African Rand, even at the most optimistic $11 billion scenario, such an injection into what is in effect a wider currency union will only increase the combined GDP of South Africa and Namibia by 3%. It will help offset currency outflows as a result of South Africa’s $400 billion infrastructure programme.
Historical demand by user type
There is little information available of energy consumption by user-group, but it is vital to gain an understanding as different user-groups offer different opportunities – especially for renewables, where residential and small business customers pay three times what NamPower pays for its imports. This graph makes the following assumptions:
- Skorpion – actuals based on NamPower AFS
- Other mines – estimated based on 1998 report, increasing by 3% per year
- Exports – actuals based on NamPower AFS
- Rural areas – estimated based on 1998 report, increasing by 3% per year
- Residential – split into three user-groups:
- 50,000 prepaid households, who use 100 KWh per month
- 50,000 households, who use 200 KWh per month
- 40,000 households, who use 600 KWh per month (this constitutes about 12% of households. This was cross-referenced against the 2005 household electricity connection ratio of 33% and the South African residential usage of 17% of total.
This model estimates that residential users come 14% of the total.
- Commercial and government users – the difference between the total supplied by NamPower and the sum of user-groups
It estimates that this group, made up of manufacturing, heavy industry, food processing, farming, government and retail space, uses 29% of the electricity provided to the grid.
Demand forecast scenarios
The electricity intensity of GDP growth will put pressure on all power infrastructure. Based on the last ten years of mine-induced growth, every 1% of GDP growth will result in 1.3% growth in electricity demand. It is assumed that an aggressive energy saving programme will be implemented, particularly with residential customers struggling to pay bills, reducing electricity intensity to 0.8.
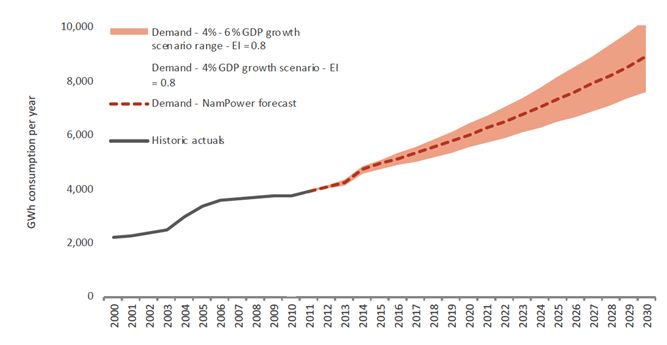
Figure 3. Namibian demand forecast/growth scenarios
For the purposes of this document, NamPower’s estimate of 4% annual electricity demand growth is used to forecast after 2014, with a cumulative 25% demand growth between 2010 reported figures and 2014, meaning that demand will double by 2030, and increase by five-fold by 2050. As can be seen from the GDP impact of the hydrocarbons and mining prospects, this has the potential to increase dramatically higher. If demand is greater, there is scope to both repeat ANE’s proposed solution and to increase the size of a single plant by up to eight fold.
[1] Summarised from Wikipedia – http://en.wikipedia.org/wiki/Namibia
[2] Source – CIA World Factbook – ppp stands for Purchasing Power Parity, meaning that goods purchased locally are adjusted for their true cost, rather than the GDP in local currency divided by the official exchange rate, which results in a lower GDP – $12.6 billion from the same source. The international poverty line is $1.25 per day. A gini co-efficient is a measure of income inequality – perfectly equal share of income would result in a Gini co-efficient of 0, while the Gini coefficient would be 1, if one person earned all the money in the economy. Note that Global Finance magazine estimate for GDP was $14.6 billion in 2009, about 5% higher than the CIA world fact book.
http://www.gfmag.com/gdp-data-country-reports/213 – namibia-gdp-country-report.html#axzz1di5DaFOC.
[3] Source – Electricity consumption in Namibia – NamPower Annual Financial Statement, divided by the population estimate from note 1.
[4] Analysis performed by the author based on electricity consumption and population data provided by the CIA World Factbook.
[5] Source – Michael Dynes of African Investor in conversation with the author.
[6] Source – Kenyan Ministry of Energy – Update of the Least Cost Power Development Plan – 2009-2029 published in March 2008.
[7] Based on data from the 2001 Census, the last census for which data are available. Compared to the World Energy Outlook 2006 Table B2 Electricity Access in 2005: Africa – page 568, which also provides the data for Figure 4
[8] Discussions in Windhoek, June 2011 with various engineering firms involved in tenders in Africa outside Namibia.
[9] Sources – various – the 1998 Ministry of Mining and Energy Affairs estimated that mine electricity demand was 630 GWh confirmed in a later NamPower set of annual financial statements. Key mining companies include NAMDEB (diamonds), Rossing Uranium and Rosh Pinah. As Navachab Gold Mine has opened in 2003, and Ongopolo Mining has reopened the old copper mine in Tsumeb, it is estimated that mining demand has increased by a compound annual growth rate of 3% since, increasing the demand of these main mining assets to 900 GWh. Skorpion Zinc Mine’s electricity consumption is disclosed in the country’s financial statements as it is so significant – increasing electricity demand by over 20% in 2004 when the mine ramped up to full production. Demand in 2010 according to NamPower’s Annual Financial Statements was 673GWh. NamPower does not publish detailed information about user profiles, so information has been collated and extrapolated from several sources to give this estimate.
[10] Speech made by Mines and Energy Affairs Minister Isak Kitali on 7 July 2011 – http://www.iol.co.za/business/international/namibia-sees-11-bln-barrels-in-oil-reserves-1.1094806


0 Comments